Preferences...
General tab
The General preferences tab allows the user to customize general appearance and behavior.
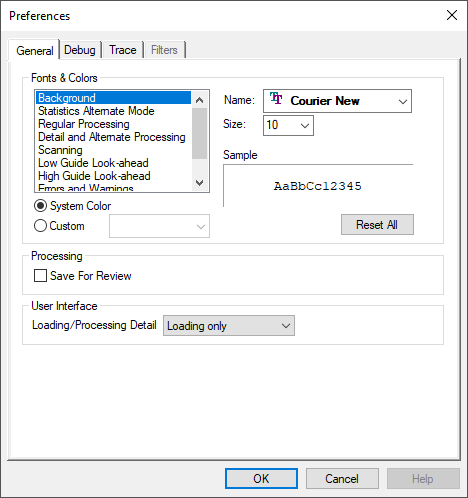
Fonts and colors used in the Trace windows
Automatic generation of a “Save for Review” zpj file on exit
Display of a “Loading…” dialog at the start of processing
Debug tab
The Debug preferences tab allows the user to customize the visual debugger appearance and behavior.
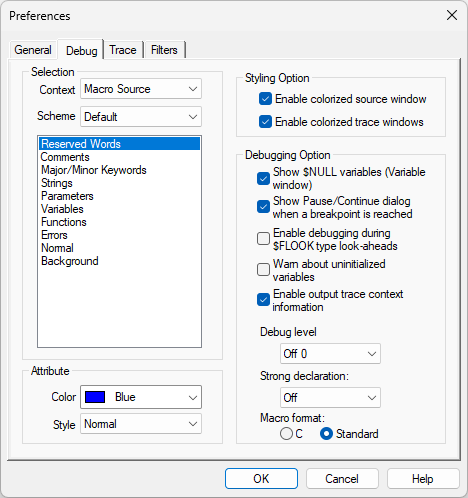
Colorization settings of text in the Source and Trace windows
Various debugging options, including:
the display of variables with $NULL value in the Variables window;
the display of a Pause/Continue dialog when a breakpoint is encountered;
the ability to debug into $FLOOK type look-aheads; and
the option to diagnose uninitialized macro variables when they are used in an expression.;
Enable contextual help of codes and registers in the Output trace window
The debug level, which can be adjusted at any time during processing allows for extra information to be output to the console:
Level 0: Debug traces are OFF.
Level 1: For user defined extra information.
Level 2: For internal processing extra information.
Level 3: For even more advanced internal processing information.
A higher Debug Level also includes all extra messages of lower level.
Alternatively, the $DBGLVL macro variable can be used to query the current Debug Level or change it. This can be done by macro or using the debugger variable window.
User implementing their own messages using this mechanism should test the $DBGLVL and issue their message if the value is not zero.
Macro strong declaration setting, uninitialized variable testing and formatting
Selection of either the C style or standard APT style representation format of macro source
Trace tab
The Trace preferences tab allows the user to customize Trace/Source window size and content.
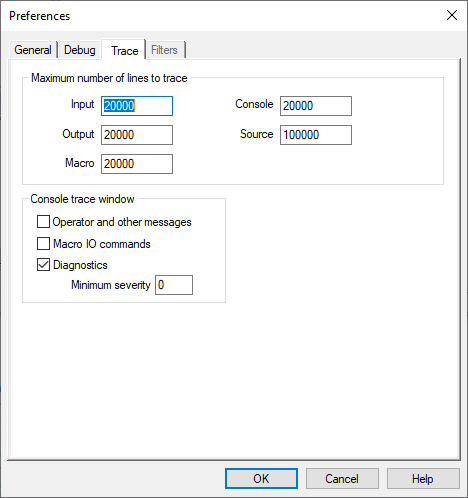
Limit number of lines written to the Trace and Source windows
Console trace window options, including:
tracing of operator (DISPLY command) and other messages;
tracing of MACRO I/O command processing; and
tracing of diagnostic messages at or above a specified minimum severity.